
Power
Utility, switchgear, transformers, PDUs
Digital Twin for Data Centers
Make energy, water, carbon, reliability, and capacity work as one.
Turn fragmented data into real-time operational context, anticipate risk before it escalates, and evaluate how to operate or expand without compromising uptime.
Why It Matters
01
Reveal avoidable cooling, electrical and capacity losses. Optimize against actual workload demand and operating constraints — not static assumptions.
02
Connect chiller health, UPS reliability, thermal conditions and redundancy paths. Detect emerging issues early and act with greater confidence.
03
Bring energy, water, emissions and resource-utilization data into one traceable view, then connect each improvement to its operational impact.
Industry Introduction
A data center is not a collection of independent machines. It is a tightly connected thermal, electrical and digital ecosystem. Every new GPU, shift in workload, chiller adjustment or battery condition changes how the rest of the facility behaves.
Visionaize connects those decisions — an operational view of assets, dependencies, performance and projected consequences, so teams can optimize electricity and water demand while respecting redundancy and thermal limits.
From a single data hall to a multi-site campus: dependable capacity with less resource waste and better evidence for every sustainability decision.
See How Visionaize Connects Your InfrastructureA chiller can look healthy while energy per unit of cooling deteriorates. A water-saving mode can raise electricity use. Visionaize brings topology, telemetry, history and maintenance into one context — so teams ask not only “what changed?” but “which action delivers the best combined outcome?”
What the twin connects
Every asset is linked to its physical location, live state, upstream dependencies and downstream impact.
Utility, switchgear, transformers, PDUs
UPS modules, batteries, A/B paths
Chillers, pumps, CRAH/CRAC, liquid loops
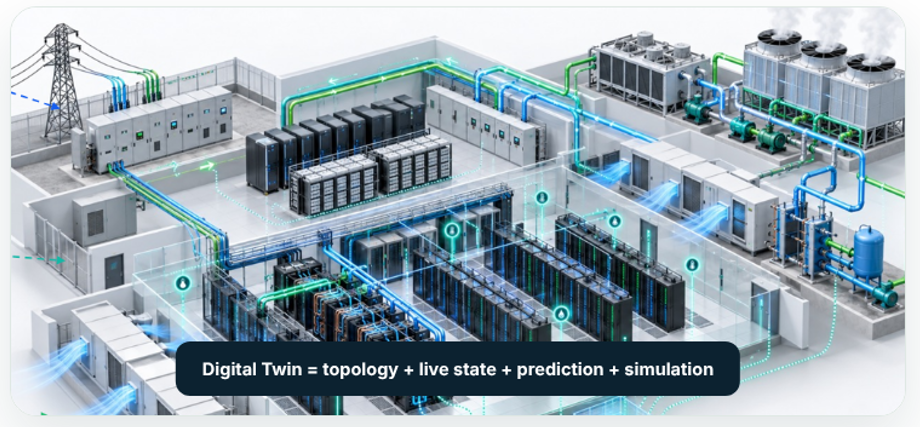
Servers, GPUs, racks, workloads
Temperature, humidity, pressure, airflow
Energy use, losses, PUE and carbon context
Power, Cooling & Environment
Trace energy and failure impact from utility intake to individual GPU servers, and correlate chilled water, air delivery and heat load rather than optimizing each subsystem on its own.
Voltage, frequency, demand
Breaker state, protection, power quality
Load, efficiency, bypass, module health
State of health, impedance, runtime
Breaker current, phase balance, losses
Power draw, PSU health, utilization
Failure prediction • Load balancing• Runtime confidence
Loss analysis • Redundancy verification• Capacity headroom
COP / efficiency Approach temperature Compressor condition
Flow and pressure Speed / power Hydraulic imbalance
Fan speed Valve position Supply temperature
Inlet / outlet temperature Humidity and pressure Airflow / recirculation
Workload heat Fan speed Thermal throttling
Supply/return water temperature • delta-T• flow • differential pressure • fan speed• rack inlet/outlet • humidity • airflow• ambient conditions
Servers, Racks & GPUs
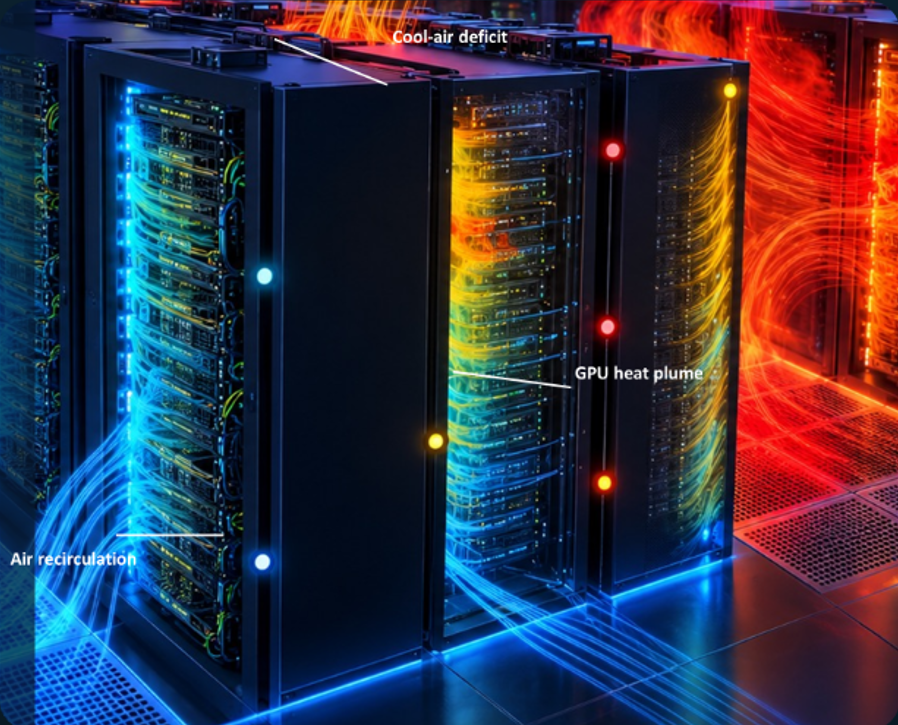
The twin links every workload and device to the electrical and cooling resources that support it.
hotspots • recirculation• thermal runaway• fan degradation• workload-driven risk
What-if simulation
Compare alternatives across thermal behavior, power flow, PUE, resilience and capacity, before physical changes are made.
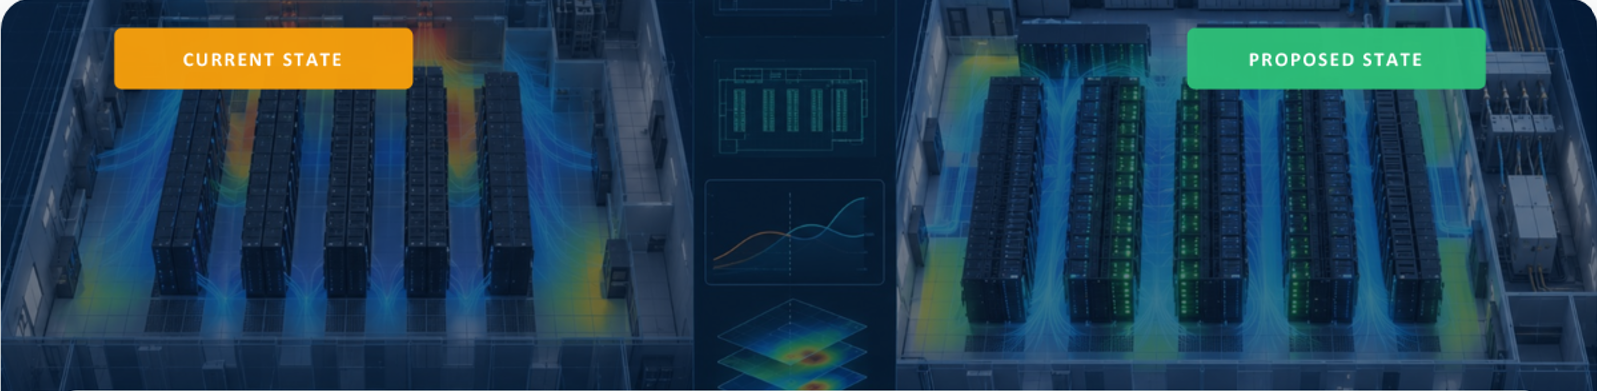
Compare outputs
Add GPU racks • relocate workloads• change containment• adjust setpoints• upgrade chiller or UPS• take equipment out of service
Thermal map • peak kW• PUE • redundancy margin • time-to-capacity• implementation risk
Model. Analyze. Decide with confidence.
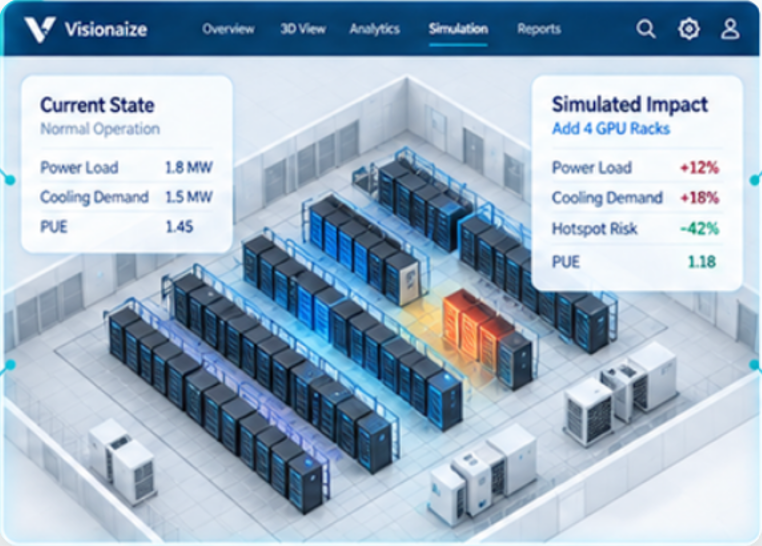
Power load
+12%
Cooling demand
+18%
Hotspot risk
−42%
PUE
1.18
Illustrative scenario (“Add 4 GPU racks”). Sample values, not a customer result.
Use case spotlights
Illustrative solution workflows, not published customer case studies or verified project results.
USE CASE (01 of 03)
Cooling demand shifts with workload density, outside conditions, and equipment health. Conventional controls can overcool low-load zones or miss inefficient chiller and cooling-tower operation.
Connected operations
Illustrative operational context — sample visualization, not live customer data.
Signature narrative
A better PUE is valuable, but it is only one part of the responsibility. The digital twin evaluates the combined effect of every decision on energy, water, carbon, capacity and resilience.
Energy
MWh · PUE
Water
Litres · WUE
Carbon
Scope 2 view
Resilience
Thermal + headroom
Separate useful IT consumption from avoidable overhead in a time-aligned view.
Make water a managed operating variable, not an annual figure.
Traceable link from operating action to electricity effect to reported emissions. Location- and market-based Scope 2 support.
Build only what you need. Find the first limiting system, compare upgrade sequences, avoid rework.
Resilience is a non-negotiable constraint. Operators review simulations before authorizing change.
Operating model & architecture
Visionaize builds on your existing BMS, DCIM, EPMS and maintenance tools — rather than replacing them.
01
BMS/DCIM, EPMS/SCADA, UPS/PDU, meters, GPU telemetry, CMMS, weather, water
02
OPC UA, BACnet, Modbus, SNMP, APIs, historians, secure edge
03
Hierarchy, 2D/3D location, A/B paths, cooling zones, change history
04
Anomaly detection, risk models, capacity forecasts, scenarios, KPIs
05
Context-rich alerts, recommendations, workflows, approved changes
Cooling & thermal
Chiller kW/ton, supply/return, delta-T, CRAC/CRAH, airflow, rack inlet, humidity, liquid cooling
Electrical resilience
Transformers, switchgear, breakers, UPS mode/load, battery health, PDU loads, A/B paths
IT & workload
Servers, racks, GPUs, utilization, power draw, thermal throttling
Water & sustainability
Make-up/blowdown, site meters, weather, renewable records, emission factors
Work management
Asset inventory, service history, alarms, work orders, approved changes
Visionaize + Moro Hub
Digital Twin + AI connects critical infrastructure, predicts risk and simulates change before implementation.
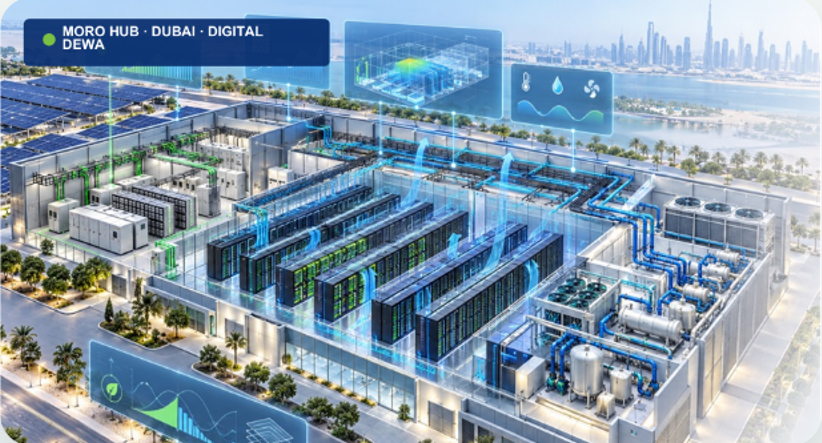
Unify servers, racks and GPUs with UPS, batteries, power distribution, chillers, pumps and cooling zones, plus temperature, humidity, airflow, energy and PUE.
Detect cooling or UPS failure risk, GPU / server overheating, abnormal power consumption and chiller degradation.
Test new racks, higher GPU density, load redistribution and failure scenarios. Assess power, cooling, capacity and PUE before execution.
M()RO
Hub · Dubai
Target: resilient, efficient and AI-ready operations
Expected impact
Earlier risk detection
Higher uptime & resilience
Lower energy & PUE
Safer capacity expansion
Partner imagery and wording subject to MORO Hub approval. Rendering is conceptual, not a statement of a live installation.
Measure · Validate · Scale
Weeks 1–4 (indicative)
Confirm scope, map data, verify meter quality and set baselines.
Weeks 4–7
Associate sensors with rooms, racks and topology; agree operating envelopes.
Weeks 7–12
Configure anomaly, efficiency or scenario workflows with facility experts.
Weeks 12–16
Assess results, tune workflows, train users, plan phased expansion.
12–16 week pilot is an indicative planning approach, not a fixed commitment.
Facility electricity
MWh and peak kW
PUE
Facility ÷ IT energy
WUE
Site water (L) ÷ IT kWh
GHG emissions
Operational tCO₂e
Cooling & thermal compliance
Hotspots, OEM thresholds
Availability & risk
Anomaly lead time
Usable resilient capacity
Headroom after power, cooling, redundancy and maintenance constraints
Steady 10 MW IT load · mathematical illustration only
PUE 1.50 → 15 MW
PUE 1.40 → 14 MW
≈ 8,760 MWh per year difference
Illustrative only — not a customer result, guarantee or forecast.
The Visionaize Advantage
Not another dashboard in the control room — a way to understand what to do next, and why.
Assets, data, documents and dependencies in 2D/3D context.
From degrading chillers to future rack-density limits.
Understand effects before a live system is altered.
Energy, water and carbon inside safety limits.
Begin with a priority use case, expand with measured results.
Expert consultation
One high-density hall or a multi-site estate — find where connected intelligence can improve energy, water, capacity and reliability.
Visionaize Perspective
From PUE to Whole-Facility Intelligence
Resource
Power Usage Effectiveness is only the beginning. Explore how operational digital twins connect energy, water, carbon transparency and resilient capacity planning.
Show as downloadable only once the asset is produced.
FAQ
An operational representation that connects physical infrastructure and IT systems with live or recent data, equipment relationships, analytics and decision workflows — unlike a static 3D model, it helps users evaluate risk and compare scenarios.
It can connect energy, water, carbon, and capacity indicators to the equipment and operating choices that influence them. Results depend on available data and agreed measurement boundaries.
No. It can provide connected operational context across existing systems and data sources; it is not a replacement for controls, monitoring, or facility expertise.
A digital twin helps teams understand the operational factors behind PUE and WUE, test improvement scenarios, and evaluate trade-offs while keeping reliability and site constraints in view.
A focused pilot may take 12–16 weeks as an indicative planning range. Timing depends on scope, data readiness, integration needs, and site access.